


PetMeds® Announces Its Third Fiscal Quarter Financial Results and Its Quarterly
Dividend of $0.30 Per Share
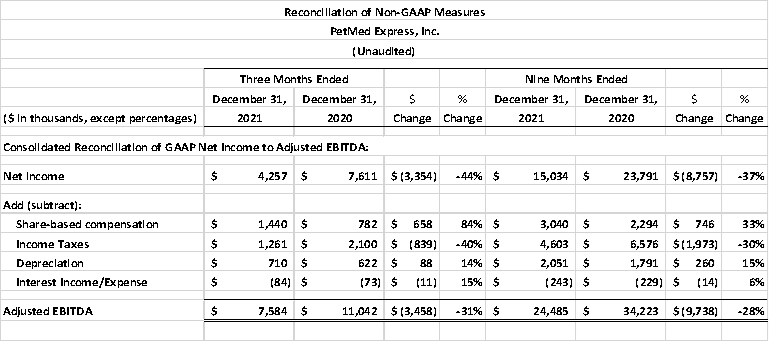
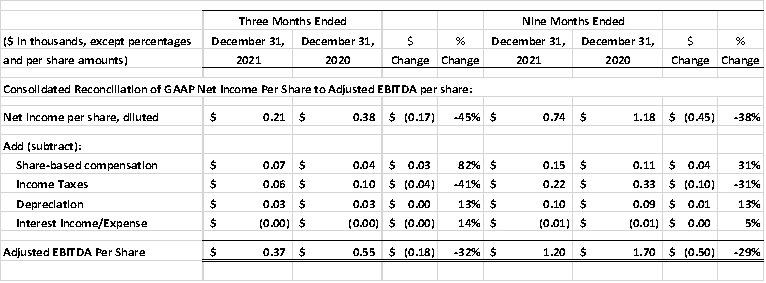
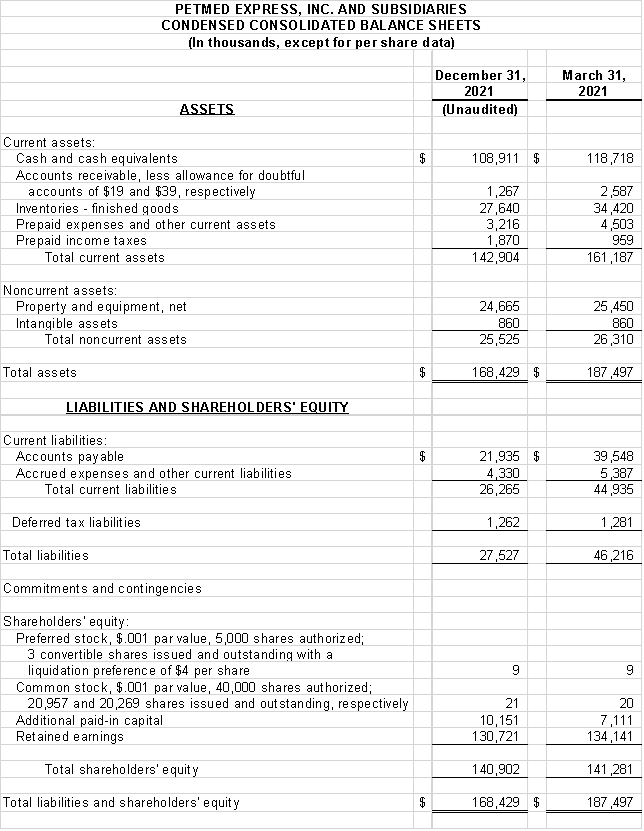
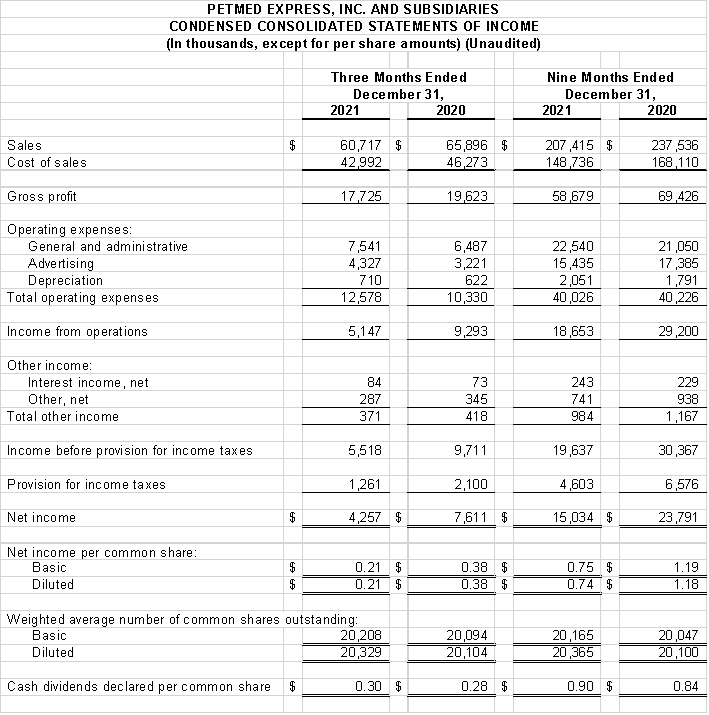
Delray Beach, Florida, January 24, 2022, PetMed Express, Inc. (NASDAQ: PETS) today announced its financial results for the quarter ended December 31, 2021. Net sales for the quarter ended December 31, 2021, were $60.7 million, compared to $65.9 million for the quarter ended December 31, 2020, a decrease of 7.9%. Net sales for the nine months ended December 31, 2021, were $207.4 million, compared to $237.5 million for the nine months ended December 31, 2020, a decrease of 12.7%. Net income was $4.3 million, or $0.21 diluted per share, for the quarter ended December 31, 2021, compared to net income of $7.6 million, or $0.38 diluted per share, for the quarter ended December 31, 2020, a 44% decrease to net income. Net income was $15.0 million, or $0.74 diluted per share, for the nine months ended December 31, 2021, compared to net income of $23.8 million, or $1.18 diluted per share, for the nine months ended December 31, 2020, a 37% decrease to net income. Adjusted EBITDA (1) was $7.6 million, or $0.37 diluted per share, for the quarter ended December 31, 2021, compared to adjusted EBITDA of $11.0 million, or $0.55 diluted per share, for the quarter ended December 31, 2020, a 31% decrease to adjusted EBITDA. Adjusted EBITDA was $24.5 million, or $1.20 diluted per share, for the nine months ended December 31, 2021, compared to adjusted EBITDA of $34.2 million, or $1.70 diluted per share, for the nine months ended December 31, 2020, a 28% decrease to adjusted EBITDA. Our average order size increased from $88 to $89 for the quarters ended December 31, 2020 and 2021, respectively.
"We are executing rapidly against our business transformation of PetMeds across people, process, and product," said Matt Hulett, CEO and President. "The future of PetMeds is much broader than just a prescription eCommerce company and we expect to show progress in the coming quarters as we develop into a broader expert health and wellness offering."
The Board of Directors declared a quarterly dividend of $0.30 per share on the Company's common stock. The dividend will be payable on February 18, 2022, to shareholders of record at the close of business on February 7, 2022. The Company intends to continue to pay regular quarterly dividends; however, the declaration and payment of future dividends is discretionary and will be subject to a determination by the Board of Directors each quarter following its review of the Company's financial performance.
This afternoon at 4:30 P.M. Eastern Time, the Company will host a conference call to review the quarter's financial results. To access the call, which is open to the public, please dial (877) 407-0789 (toll free) or (201) 689-8562. We will also provide a link at https://www.1800petmeds.com/investor.html for those who wish to stream the call via webcast. For those unable to participate in the live event, the call will be available for replay from 7:30 P.M. Eastern Time on January 24, 2022, until February 7, 2022, at 11:59 P.M Eastern Time. To access the replay, call (844) 512-2921 (toll free) or (412) 317-6671 and enter passcode 13726200.
Founded in 1996, PetMed Express is America's Most Trusted Pet Pharmacy®, delivering prescription and non-prescription pet medications and other health products for dogs, cats, and horses at competitive prices direct to the consumer through its 1-800-PetMeds toll free number and on the Internet through its website at www.petmeds.com.
This press release may contain "forward-looking" statements, as defined in the Private Securities Litigation Reform Act of 1995 or by the Securities and Exchange Commission, that involve a number of risks and uncertainties, including the Company's ability to meet the objectives included in its business plan. Important factors that could cause results to differ materially from those indicated by such "forward-looking" statements are set forth in Management's Discussion and Analysis of Financial Condition and Results of Operations in the PetMed Express Annual Report on Form 10-K for the year ended March 31, 2021. The Company's future results may also be impacted by other risk factors listed from time to time in its SEC filings, including, but not limited to, the Company's Form 10-Q and its Annual Report on Form 10-K.
For investment relations contact PetMed Express, Inc., Bruce S. Rosenbloom, CFO, 561-526-4444, investor@petmeds.com.
For media relations contact Butin PR, Mary Eva Tredway, maryeva@Butinpr.com.
(1) Adjusted EBITDA and adjusted EBITDA per share are non-GAAP financial measures. See "Non-GAAP Financial Measures" for additional information on non-GAAP financial measures and a reconciliation to the most comparable GAAP measures.
To provide investors with additional information regarding our financial results, we have disclosed here and elsewhere in this earnings release adjusted EBITDA and adjusted EBITDA per share, non-GAAP financial measures that we calculate as net income excluding; share-based compensation expense; depreciation and amortization; income tax provision; and interest income (expense). We have provided reconciliations below of adjusted EBITDA to net income and adjusted EBITDA per share to diluted earnings per share, the most directly comparable GAAP financial measures.
We have included adjusted EBITDA and adjusted EBITDA per share in this earnings release because they are key measures used by our management and board of directors to evaluate our operating performance, generate future operating plans and make strategic decisions regarding the allocation of capital. In particular, the exclusion of certain expenses in calculating adjusted EBITDA facilitates operating performance comparability across reporting periods by removing the effect of non-cash expenses. Accordingly, we believe that adjusted EBITDA and adjusted EBITDA per share provide useful information to investors and others in understanding and evaluating our operating results in the same manner as our management and board of directors.
We believe it is useful to exclude non-cash charges, such as, share-based compensation expense and depreciation and amortization from our adjusted EBITDA and adjusted EBITDA per share because the amount of such expenses in any specific period may not directly correlate to the underlying performance of our business operations. We believe it is useful to exclude income tax provision; interest income (expense) which are not components of our core business operations. Adjusted EBITDA and adjusted EBITDA per share has limitations as financial measures, and you should not consider it in isolation or as a substitute for analysis of our results as reported under GAAP. Some of these limitations are:
- Although depreciation and amortization are non-cash charges, the assets being depreciated and amortized may have to be replaced in the future and adjusted EBITDA and adjusted EBITDA per share does not reflect capital expenditure requirements for such replacements or for new capital expenditures;
- Adjusted EBITDA and adjusted EBITDA per share does not reflect share-based compensation. Share-based compensation has been, and will continue to be for the foreseeable future, a material recurring expense in our business and an important part of our compensation strategy;
- Adjusted EBITDA and adjusted EBITDA per share does not reflect interest income (expense), net; or changes in, or cash requirements for, our working capital; and
- Other companies, including companies in our industry, may calculate adjusted EBITDA and adjusted EBITDA per share differently, which reduces its usefulness as a comparative measure.
Because of these limitations, you should consider adjusted EBITDA and adjusted EBITDA per share alongside other financial performance measures, including various cash flow metrics, net income, net margin, and our other GAAP results. The following table presents a reconciliation of net income to adjusted EBITDA and adjusted EBITDA per share for each of the periods indicated: